Cloudflare has a small but vital tool which is somewhat hidden in the account called Health Checks / Health Check Analytics. These tools allow you to check the health of various IP addresses or hostnames.
Monitoring any web application is vital, and the faster the notifications are generated the faster your support/server team can respond to issues.
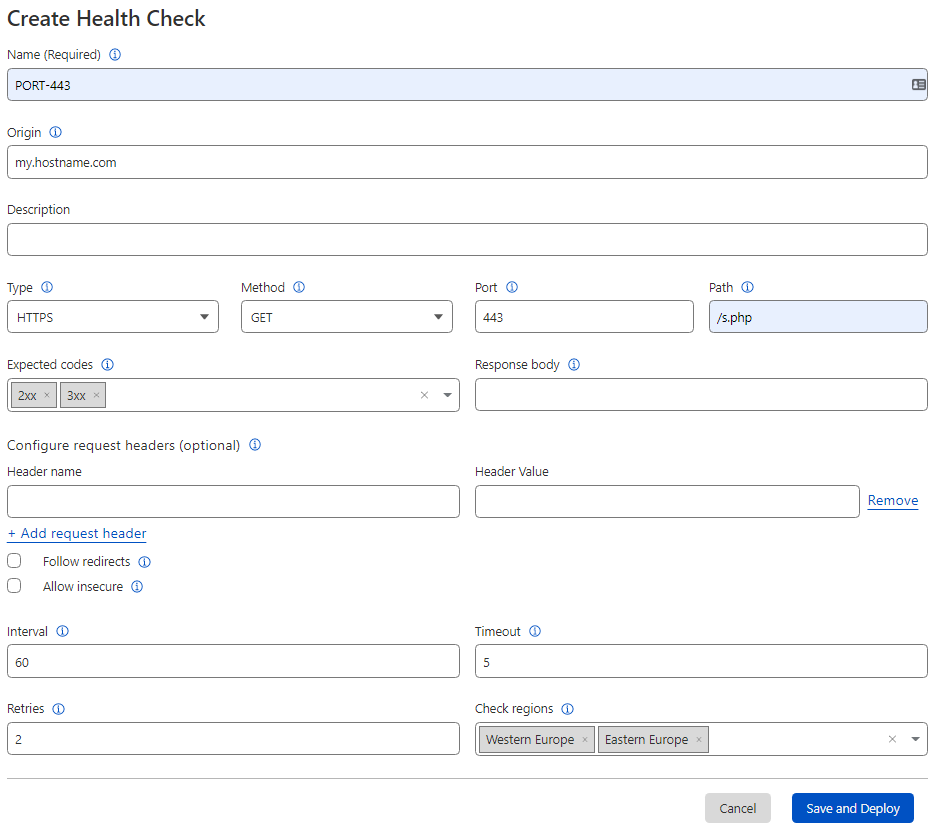
Cloudflare Health Checks allow you to check based on:
Origin: IP or hostname
Type: http, https, tcp
Methods: GET, HEAD
Port: The port to check
Path: A specific check on a URL
Expected Codes: Which status codes to return
Response Body: A case sensitive sub-string to search for in the response
Header name & Value: Optional settings
Lastly, you setup the frequency for monitoring based on:
Interval: default 60 seconds
Timeout: default 5 seconds
Retries: default 2
Region Selection: Choice of Cloudflare Regions or All
Example health check
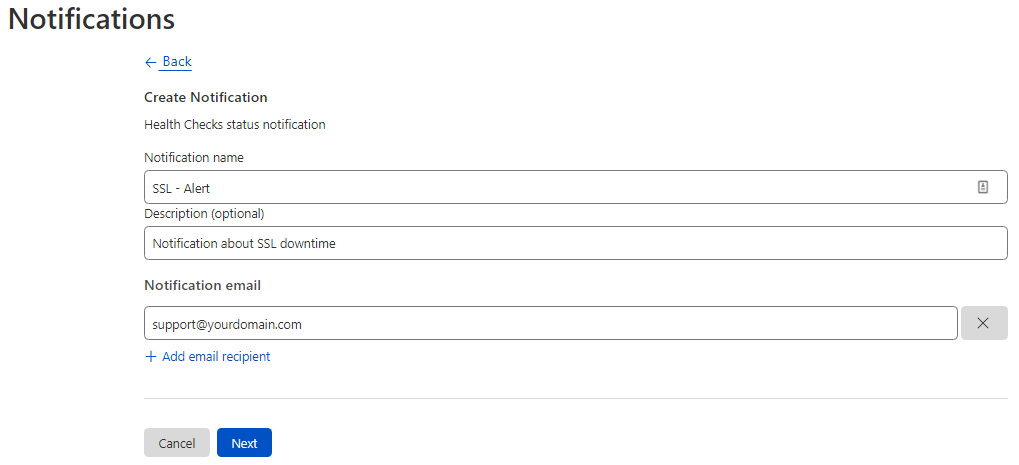
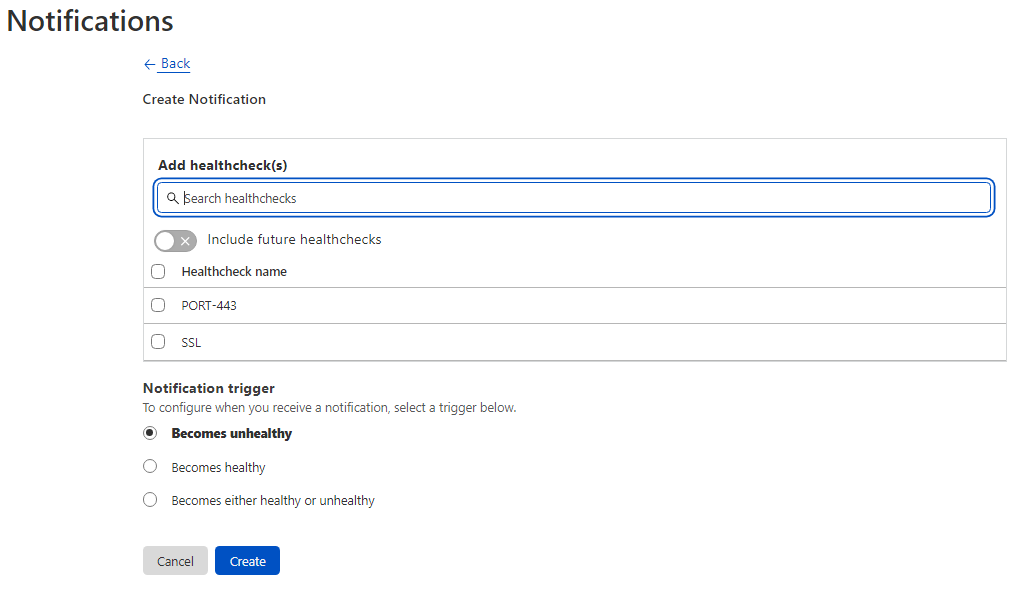
Setting up an Alert
Once the health check has been created, you then setup an Alert. These are short tasks to send out emails based on the health of the Alert. Example alerts in the screenshots below.
Alert creation Step 1Alert creation Step 2
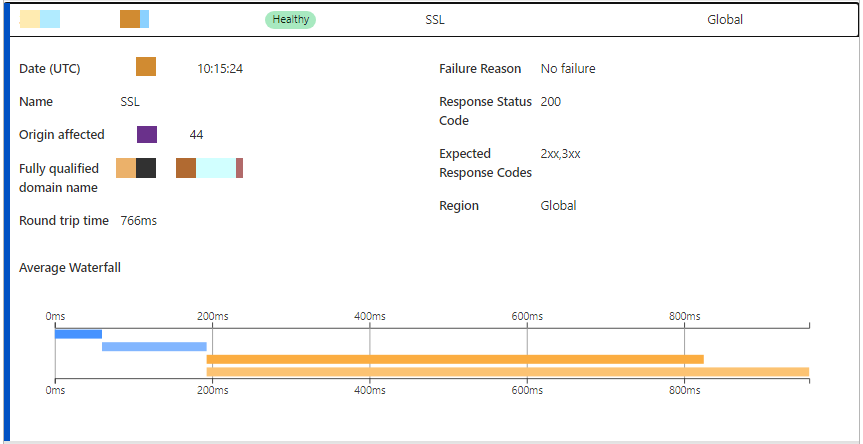
Health Check Analytics
All events are logged in the analytics dashboard for health checks, and you can quickly determine where the issues could be as certain information is passed along to analyse. An example screenshot below.
There is some important information in the waterfall, only available when you hover over the information, but this is certainly a good start to see where potential issues could lie.
Final thoughts
It is becoming more and more important to monitor the health, so one can become more reactive when servers or applications stop working and there can be many reasons for this downtime. Having a solid monitoring & notification system in place really does solve this issue.